
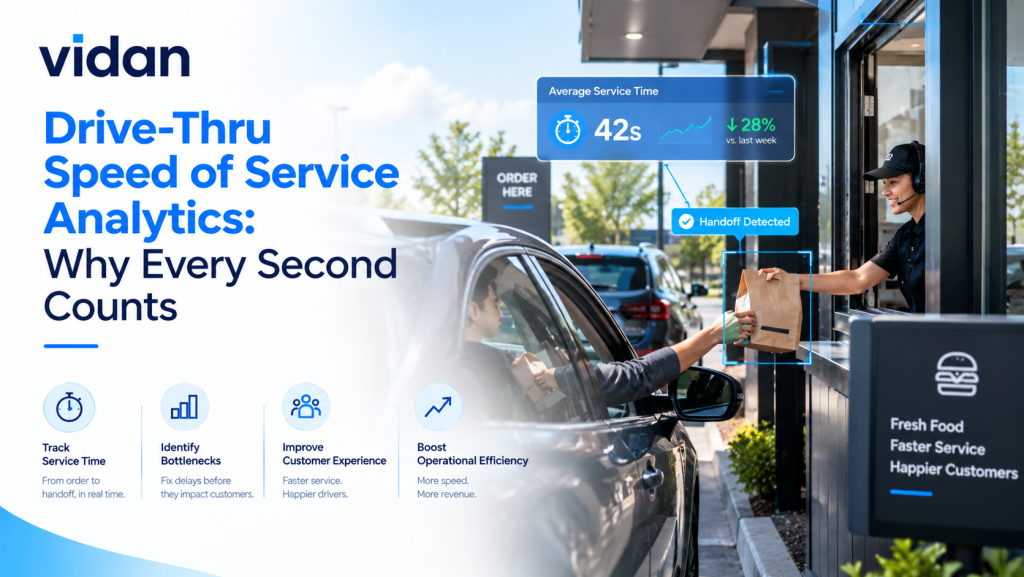
5 minutes and 24 seconds. That is the average 2026 drive-thru visit, according to Intouch Insight’s 26th annual study. Guests judge your brand inside that window. Drive-thru speed of service analytics shows where those seconds go, lane by lane and hour by hour.
Most operators still guess. They watch one rush, blame the window, and move on. The real leak is rarely where managers expect it.
Quick Answer
Drive-thru analytics times every car at every stage of the lane. It uses sensors, POS timers, or camera data. Teams then fix the slowest stage with staffing, layout, or menu changes. Faster lanes serve more cars and keep guests happier.
Key Takeaways
- Average visit time fell to 5:24 in 2026, the fastest since 2018.
- Speed ranks first among guest priorities, at 38.4% of shoppers.
- Averages hide problems. Variance between cars shows the true choke point.
- Cameras time every car without new lane hardware.
- Ten saved seconds per car adds up fast across a rush.
- Vidan AI turns existing camera feeds into lane timers and alerts.
What Is Drive-Thru Speed of Service Analytics and What Does It Track?
It is the practice of measuring how long every car spends at each stage of the lane. Teams then use those numbers to cut delays.
What Does It Measure?
Four timers matter most. Wait time comes first. Service time runs from order to pickup. Window time covers the handoff. Total time is the full visit.
Why Does It Matter for QSR Operations?
Speed drives repeat visits and peak capacity. Faster lanes lift QSR operations because every saved second repeats on every car. The same labor then serves more guests.
How Is It Different From A Manager’s Stopwatch?
A stopwatch samples a few cars. Analytics records every car on every shift. That removes guesswork and personal bias.
Which Numbers Prove That Every Second Counts?
Here are the latest figures from the industry’s most cited study.
| Stat | What It Tells You | Source |
| 5:24 | Average 2026 visit, 11.1 seconds faster than 2025 | Intouch Insight, 2026 |
| 4:04 | Average service time, down 10.3 seconds | |
| 1:40 | Average window time, down 7.5 seconds | |
| 38.4% | Shoppers who rank speed as the top factor | |
| 1:25 | Maximum time saved per visit by clear communication |
What is the surprising pattern?
Friendly visits were faster. They averaged 5:16, against 5:41 for unfriendly ones. Accuracy followed the same pattern, at 91.3% versus 73.2%. Speed and hospitality work together.
What does this mean for your lane?
Competitors keep shaving seconds. A flat result is a slow result. You need your own numbers to keep pace.
🍔 Multi Location QSR
Run 5 Stores or 500 From One Screen
Compare lanes, spot slow sites, and act before guests notice. Vidan AI brings every QSR location into one view.
Where Do Drive-Thru Lanes Lose Time?
Most drive-thru bottlenecks hide at the handoffs between stages. Use this map to find yours.
| Stage | Common Leak | Metric to Watch | First Fix |
| Menu board and speaker | Unclear audio, slow decisions | Order start delay | Simplify the board, test the speaker |
| Order point | Repeated confirmations | Order duration | Train on short readbacks |
| Payment window | Card and cash delays | Payment dwell time | Add a second payment point at peak |
| Pickup window | Waiting for food assembly | Window time | Stage items before the car arrives |
| Queue merge | Cars blocking the entry | Queue length | Mark clear lane entry points |
| Parking bay | Late items, forgotten orders | Bay dwell time | Assign one owner for bay runs |
Strong drive-thru speed of service analytics ranks these stages by lost seconds, not by opinion.
How do peak hours change the picture?
Lunch exposes weak stages. A window that works at 10 a.m. may collapse at noon. Always compare by daypart.
Which stage should you fix first?
Pick the stage with the widest swings, not the highest average. Wide swings signal a process problem. High averages often signal a menu problem.
How Do You Measure Speed Without Guesswork?
Follow this five-step checklist.
- Define stage boundaries. Agree on where each timer starts and stops.
- Capture every car. Sampling misses the bad rushes.
- Start with the queue. Run drive-thru wait time analytics on the line before the speaker.
- Add the order stage. Use service time tracking from order to handoff.
- Compare against your own baseline. Beat last month at the same daypart.
Can Cameras Do What Loop Sensors Cannot?
Yes, in most lanes. Loop sensors detect a car at a point. Cameras follow a car through the whole lane.
| Method | Captures | Limit |
| Loop sensors | Car presence at fixed points | Hard to move when the lane changes |
| POS timers | Order to payment | Misses the queue and the handoff |
| Camera analytics | Entry to exit, with visual proof | Needs clear camera angles |
AI drive-thru analytics reads your existing camera feeds and times each car automatically. Real-time video analytics flags a growing line while there is still time to react.
The cameras that catch theft can also time the lane. Our overview of AI security cameras for retail loss prevention explains the detection side.
What About Voice AI Ordering?
The 2025 study found AI lanes averaged 3:53 against 4:15 for staffed lanes. Guests also rated them less friendly. Voice AI changes the order stage only. The window and the queue still need data.
What Is the Lane Clock Framework?
We use four moves to turn timers into results.
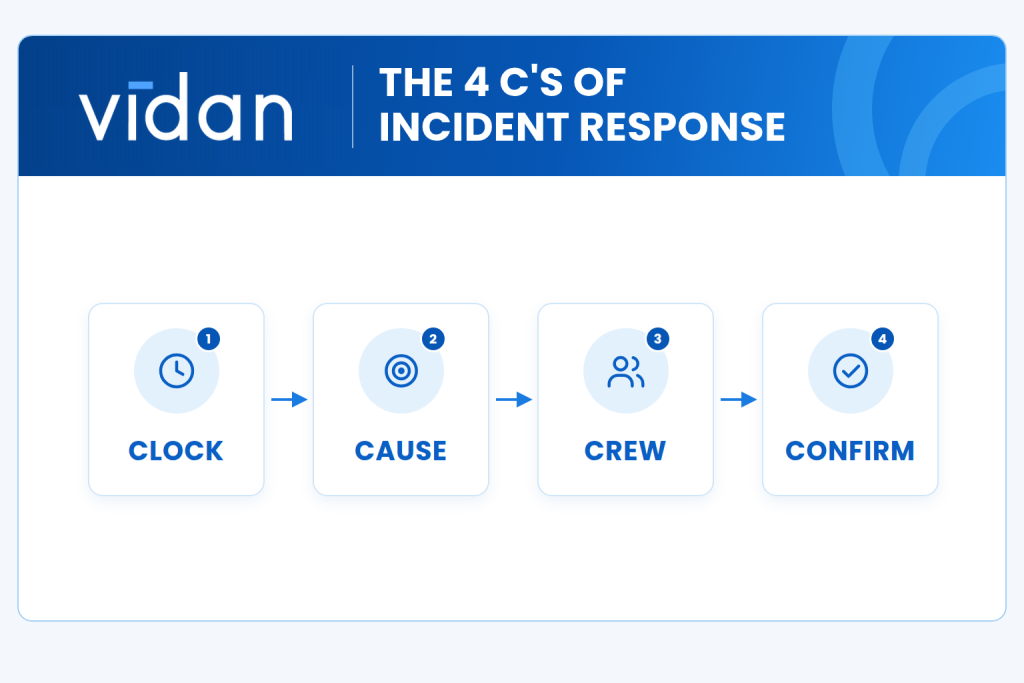
- Clock: Time every stage for every car.
- Cause: Find the stage with the widest swings.
- Crew: Change one thing. Adjust labor, layout, or menu.
- Confirm: Recheck the same stage next week.
One change at a time keeps the cause clear.
What Do 10 Saved Seconds Actually Buy?
Worked example
A lane serves 120 cars in a lunch rush. Each car saves 10 seconds.
120 cars × 10 seconds = 1,200 seconds.
That is 20 minutes of guest time returned in one rush.
This is simple arithmetic, not a client result.
That is why drive-thru speed of service analytics pays back quickly. Small gains compound across every car and every shift.
Busy Counters Need Sharper Eyes
Spot crowded service points, slow handoffs, and risky activity during your busiest hours. Vidan AI watches so your crew can serve.
How Does Vidan AI Fit Into Your Lane?
We built Vidan AI around one belief. Cameras should do more than record.
The problem we solve: Managers cannot watch every car. Reports arrive after the rush is over.
What we do: We turn your existing camera feeds into lane data. The same platform also flags theft risks, after-hours entry, and loitering.
What do your cameras become?
Each camera becomes a timer and a counter. Stages, queues, and dwell times appear in one view.
What do managers see?
They see live lane status and alerts. Drive-thru queue management improves when an alert fires at a set line length.
How do multi-location brands use it?
Regional leaders compare stores side by side. Our guide to remote video monitoring for multi-location restaurants shows how one view covers every site.
What you get: Drive-thru performance monitoring that starts with the cameras you already own.
How Should You Roll It Out?
| Timeline | Action |
| Week 1 | Connect cameras and mark the lane stages |
| Weeks 2 to 3 | Collect a baseline by daypart |
| Week 4 | Pick the widest swing stage and change one thing |
| Week 5 and beyond | Confirm the gain, then move to the next stage |
After closing, the same lane cameras can support an AI security guard workflow.
Which Myths Slow Drive-Thru Teams Down?
Myth: Faster always means unfriendly.
Reality: Friendly visits ran faster in the 2026 study.
Myth: The average tells the whole story.
Reality: Variance shows where the process breaks.
Myth: More staff fixes every delay.
Reality: Extra hands at the wrong stage add nothing.
Conclusion
Seconds leak quietly. Nobody notices until the line wraps the building. Drive-thru speed of service analytics gives you the clock. Vidan AI gives you the cameras, the alerts, and the lane view to act on it.
Ready to find your slowest stage? Book a Vidan AI demo. We will show you where your seconds go.